
One grind setting, two size peaks: Why micron specifications don’t tell the whole story
On the grinder adjustment dial, we often see a number: 12, 18, 25, or a micron level published by the manufacturer. However, after grinding, coffee grounds are not a collection of uniformly sized particles.
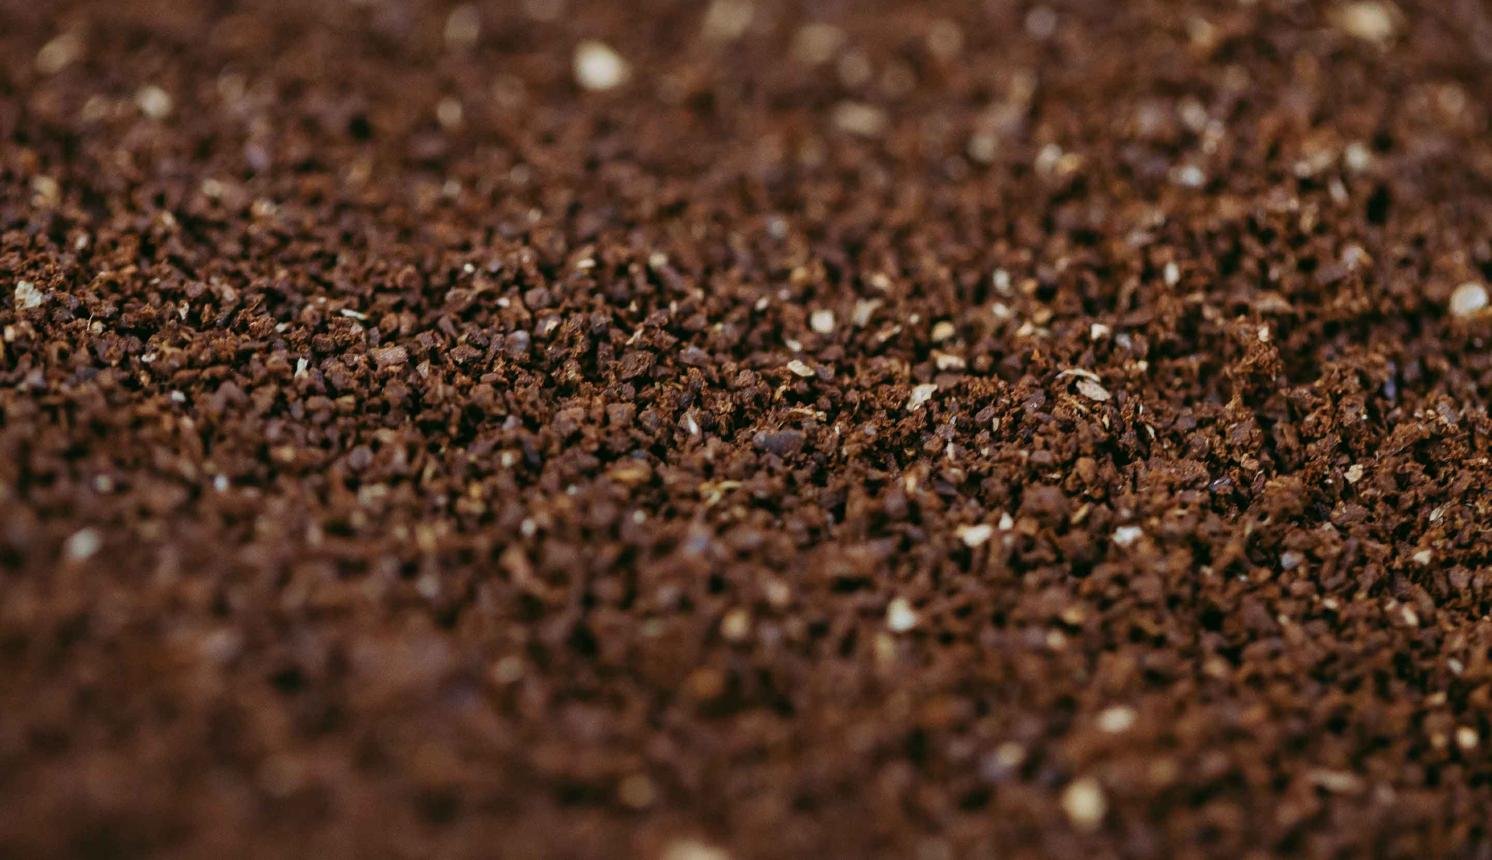
Within the same sample of grounds, very fine particles and significantly larger particles can coexist. When represented by a Particle Size Distribution (PSD) curve, many ground coffee samples show two distinct peaks. This phenomenon is called bimodal distribution.
Ground coffee does not have just one average particle size
In studies on ground coffee, the fine particle fraction is often distinguished from the coarse fraction. A study published in 2026 used a threshold of below 100 micrometers (µm) to describe the fine particle fraction and above 100 µm to describe the coarse fraction in the distribution model.
The 100 µm threshold in this case is a division serving the research model, not an absolute boundary applicable to all grinders and all brewing methods.
The key point is that the two particle groups can create two distinct concentration zones on the PSD curve. If only a median value such as D50 is recorded, information about the proportion of fine particles, the coarse particle group, and the transition zone between them may be overlooked.
What did the 2026 study measure?
Bora and Briesen, from the Technical University of Munich, published their research in the Journal of Food Process Engineering on 17/06/2026. The research team examined coffee grounds produced by four types of grinders:
- Mahlkönig EK43 – a grinder using flat burrs.
- Bosch TSM6A013B – a blade grinder.
- Comandante C40 Nitro Blade – a manual grinder.
- Comandante C60 Baracuda – a manual grinder with larger burrs.
Three Arabica bean samples were used, including two samples from the same origin but with different roast levels. The samples were ground at various settings and then measured using laser diffraction. Each sample was measured in triplicate.
The measurement system had a size range from 9 to 1,750 µm. Of the initial 30 samples, two had a portion of particles exceeding the measurement limits of the selected lens. Therefore, 28 samples were included in the model comparison; among these, 22 samples showed clear bimodal distribution, and six showed weak bimodality.
How do the grinder and adjustment settings affect the distribution curve?
The research team tested ten models combining different probability distribution functions to simultaneously describe the fine and coarse particle regions.
Three combinations with notably good fit were:
| Model | Observed characteristics |
|---|---|
| Lognormal – Weibull (LW) | Better suited for some distributions with a broad fine particle region and lower peak density. |
| Weibull – Betaprime (WB) | Delivers good results across many samples, but fit quality varies with the ratio of fines to coarse particles. |
| Gamma – Weibull (GW) | More suitable in cases featuring a narrow fines region and a high peak. |
No single model is universally best. Fit quality depends on grinder type, particle breakage mechanism, and grind setting.
In the surveyed samples, burr grinders produce a different distribution trend than blade grinders. As grind fineness increases, the proportion of fines changes, while the peak position of the fines region does not necessarily shift in correspondence with the coarse particle region.
The study notes that grinder type and grind setting have a more pronounced effect than roast level in the sampled cohort. However, this should not be interpreted as roast level having no effect on grinding. The results reflect only the specific samples and experimental conditions of this study.
Why is the proportion of fines related to espresso extraction?
This point connects to another empirical study. Smrke, Eiermann, and Yeretzian published a 2024 study on the role of fines in espresso extraction kinetics.
In that experiment, the research team actively varied the proportion of fines in the coffee powder and measured flow rate, extraction time, extraction yield, and several aromatic compounds. The results showed that as the proportion of fines increased, the permeability of the coffee puck decreased, flow rate dropped, and extraction time lengthened.
This explains why two powder samples with the same D50 can produce different flow rates if their fine particle ratios differ. A median value cannot describe the entire structure of the powder bed.
Another study published in 2026 used X-ray computed micro-tomography to investigate coffee puck permeability. The authors' model emphasizes the roles of connected pore volume and the contact surface area between water and coffee particles.
Application in grinder quality control
For coffee shops or roasting facilities, it is not necessary to use complex mathematical models for daily operations. However, this study suggests a better approach to equipment evaluation:
- Do not compare grinders solely by grind setting or a single average micron value.
- If measurement capabilities allow, record the PSD curve and fines ratio alongside D10, D50, and D90.
- When comparing two grinders, use the same coffee sample, roast level, and sampling procedure.
- Record extraction time, flow rate, TDS, and extraction yield to determine whether differences in ground coffee actually affect brewing outcomes.
- Do not assume that a high proportion of fines is always detrimental. Their impact must be evaluated in relation to the brewing method, powder bed permeability, and sensory goals.
It is important to distinguish: the 2026 study by Bora and Briesen focused on developing a model to describe particle size distribution, not on a tasting experiment directly proving which model yields the best cup. The link to espresso flow dynamics is supported by separate empirical studies.
Therefore, when evaluating a grinder, the question is not just how fine it can grind in micrometers. More important considerations are the particle distribution it produces, the consistency between grinds, and whether that distribution suits the brewing method being used.
For more content on coffee brewing and extraction, consult the knowledge library.
References
- Bora, M. & Briesen, H. (2026). Characterization of Bimodal Particle Size Distribution of Ground Coffee Powder. Journal of Food Process Engineering, 49(6), e70645. https://doi.org/10.1111/jfpe.70645
- Smrke, S., Eiermann, A. & Yeretzian, C. (2024). The Role of Fines in Espresso Extraction Dynamics. Scientific Reports, 14, 5612. https://doi.org/10.1038/s41598-024-55831-x
- Wadsworth, F. B. et al. (2026). A Model for the Permeability of Coffee Pucks Validated Using X-Ray Computed Micro-Tomography. Royal Society Open Science, 13(4), 252031. https://doi.org/10.1098/rsos.252031